I build visualisations and tools to help you understand, explore and communicate your data
Print-ready reports and handouts
I make print-ready visualistions, for your annual reports, posters or handouts.
I can work with your company’s branding, style guides and template, and produce compelling and informative visualisations to strengthen your messages and insights.
Dashboards
I make dashboards, using the applications you already use within your company, such as Tableau, Qlik or Power BI.
I can take you beyond the system’s defaults and apply best practice to how your charts are designed so that your audiences can get the insights they need quickly and correctly.
Interactive online visualisations
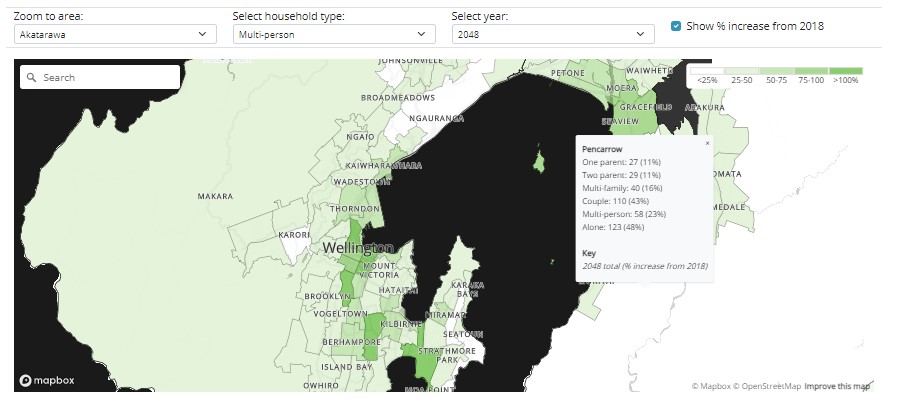
I make online visualisations and maps, so that your customers can interact with and explore your data and analysis.
The visualisations I build are web-standards based, and meet accessibility and responsive needs.
For online tools and websites, I primarilty work JavaScript, along with D3.js, ChartJS, Highcharts, Mapbox and php, and can also integrate with your tools and libraries.
Advice and training
I can help your team improve the data presentation skills, either within their existing applications or learning more wider data visualisation best practice and theory.
I can work with you to tailor the best mix workshops, mentoring or one-to-one for you and your company. This training can be focussed on a particular deliverable, such helping your staff deliver a new online portal, or it take a more wider, personal development perspective.
Business and process analysis
I can apply my wealth of buiness analysis experience to your data practices. I can work with your staff and customers to identify requirements and improvements to your data processes and systems.
Things I don't do...
To save your time, these are things I don’t do:
- Data science or in-depth statistical analysis. However I understand the field, and can work with your data scientist and statisticians to make their insights more easily accessibile to different audiences.
- Build or develop data warehouse systems. But I can work with your teams to define data structures, processes and ensure that the dashboards and reports built on your BI systems are easy to use and provide what people need.